
Although employment has improved dramatically since the peak of job loss during the pandemic, Missouri’s strong unemployment rate masks considerable geographic disparities. Further, not all Missourians have recovered equally.
Tying unemployment benefits to economic conditions that do not represent the circumstances in local areas or within specific groups would make it more difficult for Missourians to make ends meet during economic downturns.
Like the rest of the country, Missouri’s unemployment rate spiked during the COVID-19 pandemic. While the state’s pre-pandemic 2019 annual unemployment rate was 3.2%, at the height of the pandemic in April 2020, one in every nine Missouri workers (or 11.2%) were unemployed. Unemployment insurance (UI), a federal-state partnership that supports people who have lost their jobs by temporarily replacing part of their wages, helped Missourians and their families stay afloat during an unprecedented crisis.
Although the job market has improved since the pandemic started, the economic recovery has been slower for some workers compared to others. The state unemployment rate is often not representative of the economic conditions in all areas. Currently, 64 of Missouri’s 114 counties have unemployment rates above the state average of 2.93%. The majority of counties with high unemployment are clustered in rural areas of Missouri, with especially high rates in the Bootheel and southern Missouri (see Appendix for detailed rates by county and year).
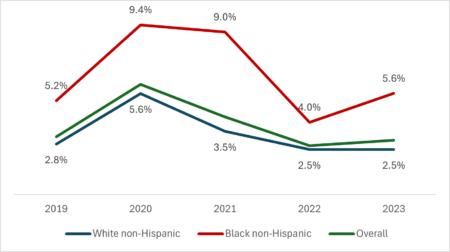
In addition, during economic downturns unemployment among Black and Brown workers rises faster and stays high longer than among white workers. This dynamic was heightened during the pandemic because Black workers were more likely to work in jobs susceptible to pandemic-related staffing reductions.
Missouri Average Unemployment Rate by Race: 2019-2023
Shortcomings of Unemployment Insurance in Missouri
While unemployment Insurance (UI) is critical for families experiencing job loss, UI benefits in Missouri are lower than most other states and are available for shorter period of time.
- Missouri’s maximum weekly benefit is $320, compared to the national average of $500.
- The state’s maximum is well below all surrounding states but Tennessee and is the seventh lowest in the country.
- Unemployment insurance benefits are available in Missouri for up to 20 weeks – far less than the 26 weeks most other states provide.
Strengthening Unemployment Insurance in Missouri
Missouri’s unemployment benefits are already some of the most limited in the nation. Restricting these benefits further by tying unemployment benefits to economic conditions that do not represent local areas or within specific groups would make it more difficult for Missourians to make ends meet during economic downturns and make it harder for our communities to recover in the future. Instead, lawmakers should focus on strengthening Missouri’s existing program by ensuring all Missourians are able to access the support they need to get them by.
Appendix: Average Annual Unemployment Rate: 2019-2023 (Unadjusted)
| 2019 | 2020 | 2021 | 2022 | 2023 | |
|---|---|---|---|---|---|
| MISSOURI | 3.1% | 6.1% | 4.4% | 2.8% | 2.9% |
| Adair | 3.7% | 5.1% | 4.3% | 3.2% | 3.5% |
| Andrew | 2.6% | 4.0% | 3.0% | 2.2% | 2.5% |
| Atchison | 3.5% | 4.0% | 3.2% | 2.5% | 2.6% |
| Audrain | 3.2% | 5.8% | 3.7% | 3.1% | 3.2% |
| Barry | 3.3% | 6.5% | 4.6% | 2.9% | 3.4% |
| Barton | 3.2% | 4.9% | 3.4% | 2.5% | 2.9% |
| Bates | 3.9% | 5.3% | 4.3% | 2.9% | 3.0% |
| Benton | 4.6% | 7.3% | 5.7% | 4.0% | 4.1% |
| Bollinger | 3.7% | 5.6% | 4.2% | 2.8% | 2.8% |
| Boone | 2.3% | 4.2% | 3.0% | 2.1% | 2.4% |
| Buchanan | 2.9% | 4.9% | 3.8% | 2.6% | 2.8% |
| Butler | 4.4% | 6.2% | 4.7% | 3.2% | 4.1% |
| Caldwell | 3.0% | 5.3% | 5.1% | 3.0% | 2.9% |
| Callaway | 2.7% | 4.4% | 3.4% | 2.5% | 2.7% |
| Camden | 4.3% | 6.9% | 5.0% | 3.5% | 3.6% |
| Cape Girardeau | 2.8% | 5.1% | 3.6% | 2.4% | 2.6% |
| Carroll | 3.1% | 5.5% | 4.4% | 2.9% | 2.8% |
| Carter | 4.7% | 6.5% | 5.2% | 3.9% | 4.2% |
| Cass | 2.9% | 5.3% | 3.9% | 2.6% | 2.8% |
| Cedar | 3.5% | 4.4% | 3.7% | 2.9% | 3.4% |
| Chariton | 2.8% | 4.0% | 3.3% | 2.2% | 2.5% |
| Christian | 2.6% | 4.9% | 3.2% | 2.2% | 2.4% |
| Clark | 3.4% | 6.0% | 4.6% | 3.3% | 3.7% |
| Clay | 2.7% | 6.0% | 4.9% | 2.8% | 2.6% |
| Clinton | 2.9% | 5.9% | 5.3% | 3.1% | 2.9% |
| Cole | 2.4% | 4.4% | 3.1% | 2.1% | 2.4% |
| Cooper | 3.5% | 5.4% | 3.6% | 2.6% | 2.9% |
| Crawford | 3.6% | 6.3% | 4.5% | 3.0% | 3.2% |
| Dade | 3.0% | 4.3% | 3.3% | 2.3% | 2.9% |
| Dallas | 4.3% | 5.8% | 4.3% | 3.0% | 3.0% |
| Daviess | 3.2% | 4.2% | 3.8% | 2.5% | 2.7% |
| Dekalb | 2.9% | 4.5% | 3.8% | 2.7% | 2.7% |
| Dent | 3.4% | 4.8% | 4.3% | 3.3% | 3.4% |
| Douglas | 4.8% | 7.6% | 4.3% | 2.9% | 3.2% |
| Dunklin | 5.2% | 7.3% | 6.1% | 4.6% | 4.9% |
| Franklin | 3.0% | 6.1% | 4.0% | 2.5% | 2.7% |
| Gasconade | 3.2% | 5.7% | 3.6% | 2.5% | 2.6% |
| Gentry | 2.5% | 3.4% | 2.7% | 2.2% | 2.6% |
| Greene | 2.5% | 5.3% | 3.4% | 2.2% | 2.5% |
| Grundy | 3.3% | 4.6% | 3.6% | 2.8% | 3.0% |
| Harrison | 3.2% | 4.5% | 3.5% | 2.5% | 2.9% |
| Henry | 3.5% | 5.8% | 4.0% | 2.8% | 2.9% |
| Hickory | 4.0% | 5.0% | 4.0% | 3.0% | 3.4% |
| Holt | 2.6% | 3.3% | 2.9% | 2.0% | 2.3% |
| Howard | 2.9% | 4.1% | 3.2% | 2.5% | 2.9% |
| Howell | 3.8% | 6.7% | 4.8% | 3.2% | 3.6% |
| Iron | 4.5% | 7.0% | 5.8% | 4.4% | 4.7% |
| Jackson | 3.5% | 7.2% | 5.5% | 3.3% | 3.2% |
| Jasper | 2.8% | 5.7% | 3.7% | 2.5% | 2.8% |
| Jefferson | 2.9% | 6.0% | 4.1% | 2.6% | 2.7% |
| Johnson | 3.5% | 5.6% | 4.4% | 2.8% | 3.1% |
| Knox | 2.8% | 4.0% | 3.1% | 2.7% | 3.1% |
| Laclede | 6.5% | 8.1% | 4.3% | 2.8% | 3.1% |
| Lafayette | 2.9% | 5.2% | 4.3% | 2.9% | 2.8% |
| Lawrence | 3.3% | 6.0% | 4.0% | 2.6% | 3.0% |
| Lewis | 3.0% | 4.9% | 3.5% | 2.5% | 2.8% |
| Lincoln | 3.1% | 6.1% | 4.6% | 2.9% | 3.0% |
| Linn | 4.6% | 6.1% | 5.4% | 3.3% | 3.7% |
| Livingston | 2.4% | 3.7% | 3.0% | 2.1% | 2.3% |
| Macon | 3.2% | 4.8% | 3.7% | 2.7% | 3.2% |
| Madison | 3.2% | 6.5% | 4.4% | 3.1% | 3.5% |
| Maries | 3.3% | 4.9% | 3.8% | 2.7% | 3.1% |
| Marion | 3.0% | 4.8% | 3.5% | 2.5% | 3.0% |
| Mcdonald | 3.2% | 5.1% | 3.9% | 2.7% | 3.1% |
| Mercer | 3.0% | 3.5% | 2.9% | 2.5% | 2.7% |
| Miller | 3.6% | 6.0% | 4.1% | 2.7% | 3.0% |
| Mississippi | 3.8% | 5.3% | 4.7% | 3.5% | 3.6% |
| Moniteau | 2.8% | 4.3% | 3.4% | 2.5% | 2.4% |
| Monroe | 4.0% | 5.9% | 4.4% | 2.9% | 3.1% |
| Montgomery | 3.0% | 4.9% | 3.7% | 2.6% | 2.9% |
| Morgan | 4.1% | 6.2% | 4.7% | 3.2% | 3.6% |
| New Madrid | 4.1% | 5.8% | 4.8% | 3.3% | 3.5% |
| Newton | 3.1% | 5.8% | 3.8% | 2.6% | 2.9% |
| Nodaway | 2.8% | 4.4% | 2.9% | 2.3% | 2.7% |
| Oregon | 3.8% | 6.8% | 5.3% | 3.5% | 3.5% |
| Osage | 2.3% | 3.6% | 2.6% | 2.1% | 2.3% |
| Ozark | 5.5% | 7.2% | 5.5% | 4.1% | 4.5% |
| Pemiscot | 4.7% | 8.0% | 7.3% | 4.8% | 4.7% |
| Perry | 2.5% | 5.5% | 3.2% | 2.2% | 2.5% |
| Pettis | 3.3% | 6.7% | 4.7% | 2.8% | 3.0% |
| Phelps | 3.1% | 4.7% | 3.7% | 2.6% | 3.0% |
| Pike | 3.3% | 5.3% | 3.9% | 2.7% | 3.1% |
| Platte | 2.5% | 5.4% | 4.0% | 2.4% | 2.5% |
| Polk | 3.3% | 4.7% | 3.5% | 2.6% | 3.0% |
| Pulaski | 3.9% | 5.6% | 4.4% | 3.2% | 3.5% |
| Putnam | 3.4% | 4.4% | 3.1% | 2.4% | 3.0% |
| Ralls | 3.0% | 4.4% | 3.4% | 2.5% | 2.7% |
| Randolph | 3.7% | 5.9% | 4.2% | 2.8% | 3.3% |
| Ray | 3.4% | 6.8% | 6.5% | 3.7% | 3.1% |
| Reynolds | 3.5% | 5.6% | 4.1% | 3.1% | 3.2% |
| Ripley | 5.2% | 7.8% | 5.5% | 3.6% | 4.0% |
| Saline | 3.0% | 4.5% | 3.5% | 2.6% | 2.9% |
| Schuyler | 4.1% | 5.8% | 4.3% | 3.1% | 3.7% |
| Scotland | 2.9% | 3.2% | 2.6% | 2.2% | 2.4% |
| Scott | 3.3% | 5.3% | 3.9% | 2.6% | 2.8% |
| Shannon | 5.2% | 7.2% | 5.6% | 4.1% | 4.3% |
| Shelby | 2.8% | 4.4% | 3.3% | 2.4% | 2.5% |
| St. Charles | 2.4% | 5.1% | 3.5% | 2.3% | 2.4% |
| St. Clair | 4.3% | 6.2% | 4.5% | 3.1% | 3.6% |
| St. Francois | 3.5% | 7.0% | 4.8% | 3.5% | 3.7% |
| St. Louis City | 3.7% | 8.6% | 6.4% | 3.8% | 3.5% |
| St. Louis County | 2.9% | 6.3% | 4.5% | 2.8% | 2.8% |
| Ste. Genevieve | 2.5% | 4.9% | 3.4% | 2.4% | 2.7% |
| Stoddard | 4.4% | 5.8% | 4.5% | 3.1% | 3.7% |
| Stone | 4.7% | 9.5% | 6.6% | 4.4% | 4.4% |
| Sullivan | 3.3% | 4.3% | 4.9% | 3.1% | 3.1% |
| Taney | 4.9% | 12.6% | 7.5% | 5.0% | 4.6% |
| Texas | 4.2% | 5.7% | 4.6% | 3.2% | 3.6% |
| Vernon | 3.3% | 4.4% | 3.4% | 2.7% | 3.3% |
| Warren | 2.7% | 5.6% | 4.1% | 2.7% | 2.8% |
| Washington | 4.2% | 7.1% | 5.1% | 3.5% | 3.6% |
| Wayne | 4.6% | 6.1% | 5.0% | 3.8% | 4.4% |
| Webster | 3.4% | 5.3% | 3.4% | 2.4% | 2.6% |
| Worth | 2.6% | 4.1% | 2.5% | 2.0% | 2.4% |
| Wright | 5.0% | 6.9% | 4.0% | 2.9% | 3.4% |